FX-controller programming - Measurement points#
Getting started part 2: Graphics & FX-Points - Measurement points#
Creating and uploading graphics / HTML pages#
Please refer to the course on the HTML / graphics editor. Editing pages is done in FX-Editor, but can also be done from the stand-alone HTML editor. There is a specific manual on how to parametrise and customise your pages.
To upload your graphics to the FX, include the files in your FX-Editor project and simply click the upload button, or right click and select “Files -> Fidelix”.
If you cannot use FX-Editor, you can manually upload the pages to the HDiskFidelixWWW folder through FTP. Don’t forget the upload the used symbols to the HDiskFidelixWWWSymbols folder also. These transfers can be done live, meaning, while the Fidelix firmware is running. Simply refresh your browser to see the changes.
FX-Points#
All FX-points-related manipulations and parameters can be done directly on the FX-controller through the normal user interface on the screen or through your browser.
The points and their parameters are stored in files inside the HDiskFidelixDATA folder.
Under normal circumstances however, we use FX-Editor to create, edit and parametrise FX-points, and then upload the necessary files to the FX when this is done on your local computer. This makes the point programming faster, easier, and especially gives you easy backups of your projects.
At any point in time you are always still able to make changes directly on the FX, and read those back in to your FX-Editor project.
To use the Fidelix FX-Editor, you need a license key. This key can be obtained by following the steps described in this knowledge base article.
When you include the HTML pages you created in the graphics editor in your FX-Editor project, it will detect all the points you used on the graphics and list them on the “Points” tab in FX-Editor. Simply run the points through a filter to include them in your project, or create the points manually and upload them to your FX.
Analogue measurements Using a classic AI-8 or COMBI-36 module:
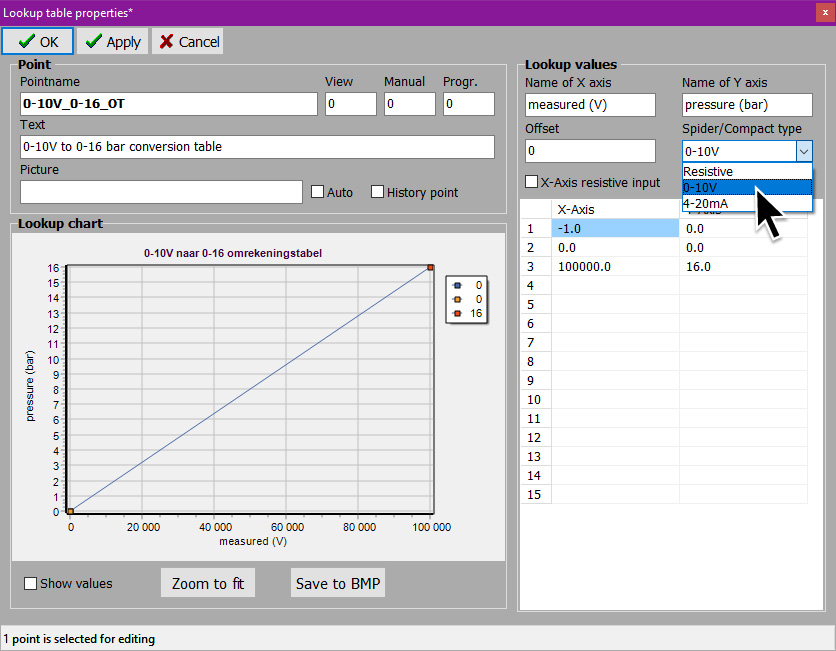
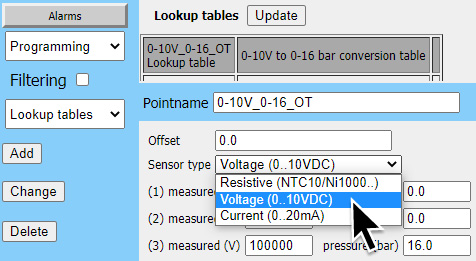
Select the type of sensor (resistive, 0-10V, 4-20mA) by setting the jumpers accordingly as marked on the PCB of the module. In the point programming of your measurement point, you have to select a conversion table to interpret the measured values correctly, and convert them into usable values. Each measurement point that is connected to a module, returns a value from 0 to 100 000 (which is in its turn the converted value read from the module’s registers).
For voltage measurement, these values are linearly linked to 0-10 V, meaning that 0=0V and 100 000=10V.
For resistive measurements, following formula should be applied: R = (4700 x FXvalue) / (100 000 - FXvalue).
For current measurements: I = FXvalue / 4 000 000.
This means that when you read a current emitting sensor, your conversion table should interpret values from 16 000 to 80 000 (as opposed to 0 to 100 000 for voltage measuring) as current measured from 4 to 20 mA.
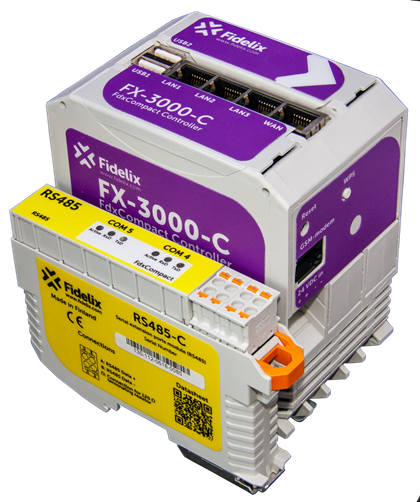
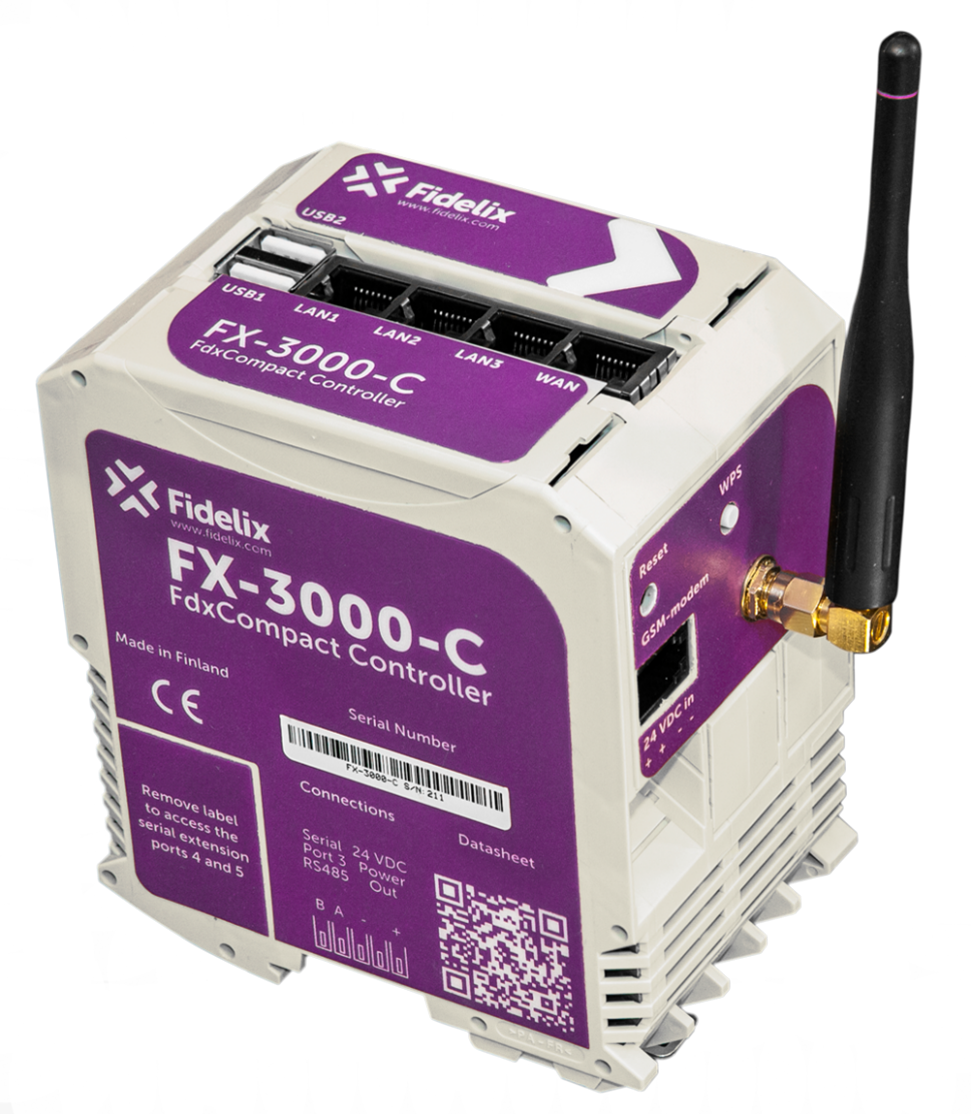
Analogue measurements Using an FdxCompact AI-8-C module or the internal I/O’s of an FX-SPIDER controller:
The type of sensor is selected in the Conversion Table (Lookup Table) you select for your measurement point.
For voltage and resistive measurements, the same values are returned as when using external modules, meaning 0-10V is expressed linearly from 0 to 100 000, and resistance can be calculated from the raw value the module returns using following formula: R = (4700 x FXvalue) / (100 000 - FXvalue).
To use current emitting sensors (0..20 mA), select the correct type of conversion table. Using the Spider, an additional resistance needs to be connected to the same input (C1-D8) between the ground (I1-J8) and the measurement point your sensor is connected to. In this setup, the Spider measures the voltage drop over the resistor, caused by the current the sensor is emitting. To get the highest possible accuracy, we recommend using a 205Ω resistance.
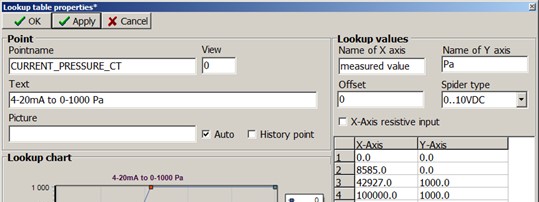
For both the FdxCompact AI-8-C module where current emiting sensor are directly connected, and the Spider, using the edditonal resistor, use following values to convert the current measurement:

- Would you however not have this 205Ω resistor available, you can also use a resistor with a different impedance and recalculate the measured values to be used in your conversion table (Lookup Table) as follows:
(Your resistor / 205 Ω) * 4 mA * 2 000 000 = FXvalue (Your resistor / 205 Ω) * 20 mA * 2 000 000 = FXvalue
- This means that for a 220 Ω resistor, following lookup table should be used:
(220 / 205) * 0.004 * 2 000 000 = 8 585 (so 4mA = 8 585 as the read value, or X-Axis value) (220 / 205) * 0.020 * 2 000 000 = 42 927 (so 20mA = 42 927 as the read value, or X-Axis value)
NOTE: Even though you can theoretically use resistors up to 512.5 Ω to measure 20 mA (500 / 205 * 0.02 * 2 000 000 = 100 000, which is the maximum value a measurement can return), the curve will no longer be linear if the current is over 10 mA. This is because certain components on the Spider’s IO-board will start conducting at voltage levels above 5V. So, when selecting your resistor, 250 Ω should really be the biggest one used.